
Authors: Jerry Qian, Molly Rowland, Arely Vasquez, Chang Yuan, and Raimundo Castro
Research Question: Can we identify what streaming service provider is being used across a VPN tunnel?
Site Guide:
- Project Purpose
- Background Information
- The Data
- The Classifier
- Accomplishments, Limitations, and Future Directions
Project Purpose
Over the past two quarters, we have been working with Viasat to understand internet traffic across a VPN. Last quarter, we worked on creating a classifier that was able to identify if video was being streamed on a VPN or there was just normal browsing occuring. This prompted our group to take this previous classifier a step further to identify what streaming service provider is being used. With the baseline of identifying video, knowing the service provider provides another layer of information that is valuable for Viasat.
When might this information be used?
When it comes to classifying which streaming service provider is being used in a VPN, there are many reasons to collect it. In working with Viasat, their goal as an Internet Service Provider is to offer the best quality experience for their customers. So if they set certain network parameters in place, such as max download rates, certain providers could be more heavily affected. By studying the network patterns of some different service providers and making a tool to classify them, this information can be used to help tune network parameters to optimize streaming for their clients.
Background Information
Key Terms!
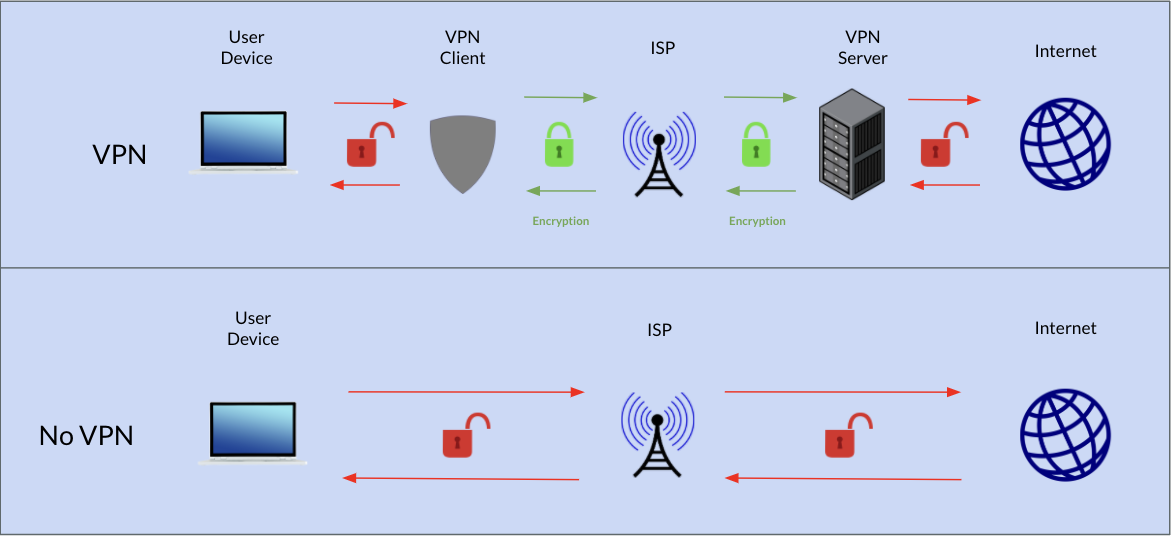
- Virtual Private Network (VPN): creates a private network across a public network
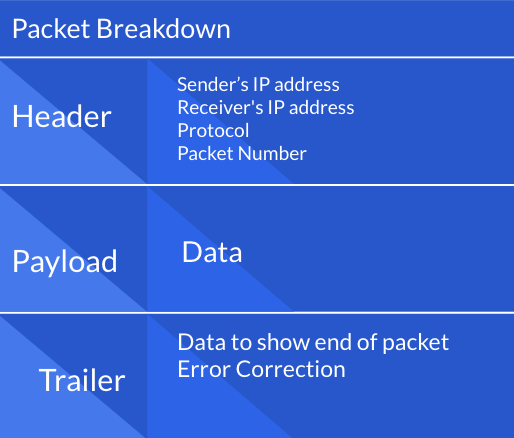
- Packet: formatted unit of data carrying information on where to send data and the payload of data
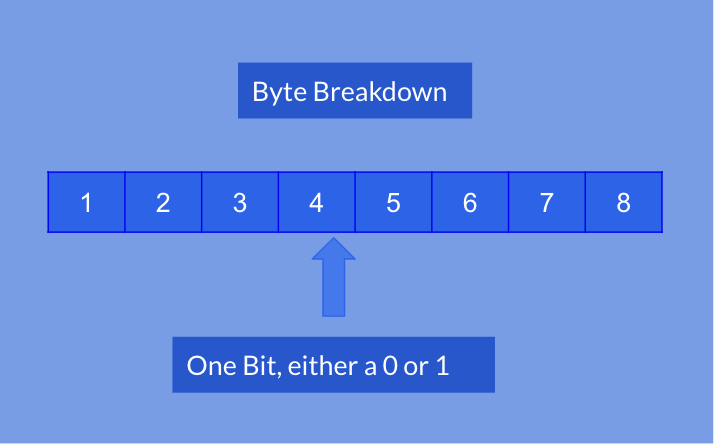
- Byte: data contained in the packet, group of 8 bits
- Live video: video that is being created and streamed at the same time
- Video on Demand: video that is created and stored on a server accessible at a later time
- Uploaded Data: any data uploaded by the computer to the server either requesting information or sending an acknowledgement of receiving data
- Downloaded Data: any data received by the computer from the server
Understanding VPNs
VPNs create a secure network connection over public networks. Some uses for them are protecting data, accessing remote computers, and by passing geographically restricted streaming libraries. Whatever the reason you are using the VPN, you want a fast connection. Below is a diagram explaining how VPNs work compared to normal internet traffic. The VPN creates an encryption level to protect your data transfers!
The Data
The dataset used in this project was generated by our group of 5 students, with the live video sourced from the live video vs video on demand classifying group. We collected data on our personal computers using a script provided by Viasat called Network Stats. The script collects packet data being sent and received by our computers. We ran our scripts in conditions that were inside a VPN, at one time speed, and had no additional noise occurring during the capture. We collected data from Youtube, Netflix, Amazon Prime, Twitch, Youtube Live, Disney+, Discovery+, and Hulu. The other category, which helps the robustness of the model classification, is made up of Disney+, Discovery+, and Hulu videos. We initally started off just testing the model on Youtube, Netflix, and Amazon Prime, but later added Twitch and Youtube Live to test the model’s features on generalizability.


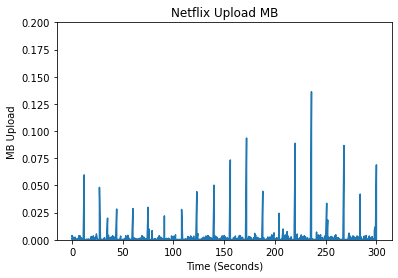
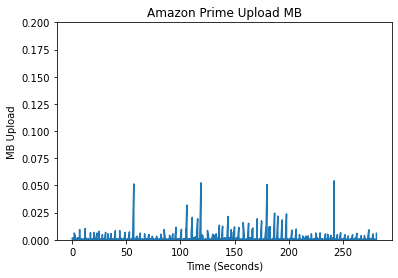
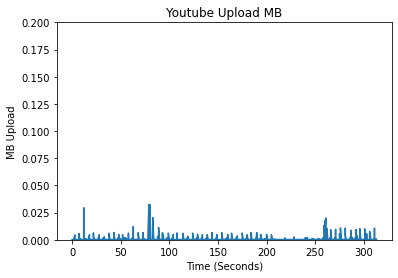
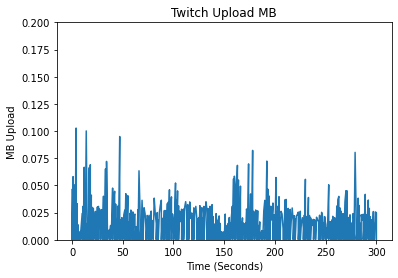
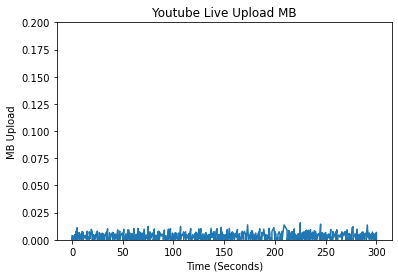
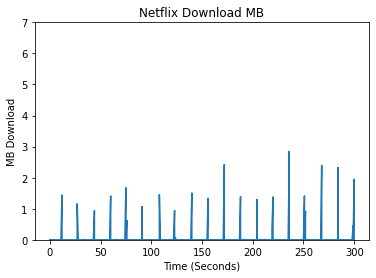
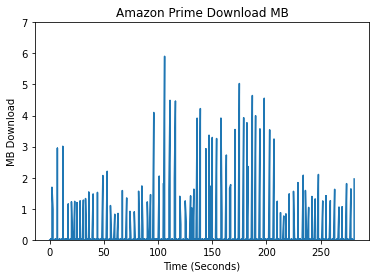
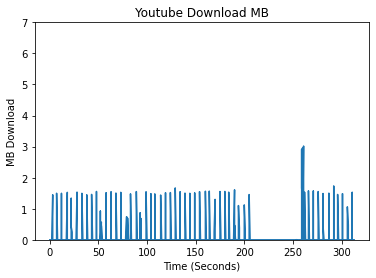
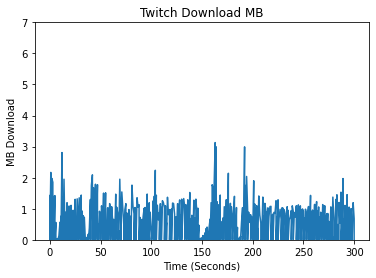
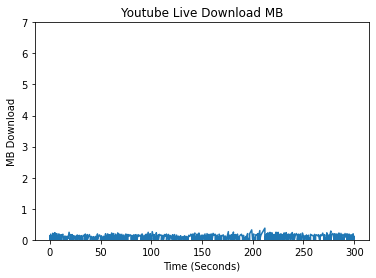
In creating features, we began by conducting exploratory data analysis (EDA) on the data from the different streaming platforms. We compared the different platforms by analyzing the differences in their packet data, spectral analysis, and a variety of other features which we deemed meaningful for identifying the different streaming platforms. An initial approach when looking at unique patterns between the different streaming platforms was looking at the upload and download bytes over time.
Comparing the Upload/Download Bytes
Click on the boxes to explore data analysis of each provider.
Comparing the Packet Size Frequencies
Another approach when looking at unique patterns between the different streaming platforms was looking at the packet sizes being transferred. When graphing the frequency of packet sizes for each streaming provider, there was a distinct pattern for each provider. Specifically when analyzing the ratio of packets from different ranges to all of the packet sizes. These ranges included [0-200] , [200-400] and [1200+] bytes. This was the initial process that led to the creation of the three features used in the final model of ratio of small, medium, and large packets. In the chart below, we can see the range of size and frequency for each provider’s packet sizes. The chart is normalized for ease of reading, so each provider’s ratio is out of 1.
The Classifier
Our model uses a random forest classifier, which is just an ensemble of decision trees! We chose to use a random forest classifer as we had previous success with identifying streaming versus non streaming data. We have engineered 13 features for our random forest classifier. While this may seem like a lot of features, each plays an important role in model performance. When we tried to remove the least significant ones, the model performance declined significantly. This however means we can’t show you one of the trees from our random forest classifier because its size and complexity makes it difficult to read. Below is an example of a single tree that would be in our forest of trees to help classify our data.
Scroll over each level to learn more about how a decision tree works!
Our model achieves an accuracy of 96.4%. Here is a list of our features that helped our model achieve this accuracy.
Feature Descriptions
| Feature | Description |
|---|---|
| smoothed_mean_delay_10s | Mean of inter-packet delay (difference in arrival time of previous and next packet) over rolling windows of 10 seconds |
| upload_bytes_cv | The Upload Byte coefficient of variation is the ratio of the standard deviation to the mean, 𝛔/𝝻, of the uploaded byte rates |
| sent_mean_size | The mean upload packet size is calculated by taking the sum of the upload packet size over the total amount of packets to get the average packet size. |
| smoothed_mean_delay_60s | Mean of inter-packet delay (difference in arrival time of previous and next packet) over rolling windows of 60 seconds |
| received_small_prop | Ratio of small downloaded packets (<200 bytes) over all downloaded packets |
| received_large_prop | Ratio of large downloaded packets (>1200 bytes) over all downloaded packets |
| received_mean_size | Mean packet size of all downloaded packets |
| large_packet_ratio | The ratio of the count of uploaded packet sizes in the size range of 1200+ bytes and the overall total number of packets. This feature is calculated over the entire dataset collected. |
| sent_small_prop | Ratio of small uploaded packets (<200 bytes) over all uploaded packets |
| max_frequency_prominence | Using Welch’s method to compute the power spectral density of downloaded packets, transformed into amplitude spectral density, then calculating the magnitude of the peak (in bytes) at the most prominent frequency (Hz) |
| small_packet_ratio | The ratio of the count of uploaded packet sizes in the size range of 0-200 bytes and the overall total number of packets. This feature is calculated over the entire dataset collected. |
| download_bytes_cv | The Download Byte coefficient of variation is the ratio of the standard deviation to the mean, 𝛔/𝝻, of the downloaded byte rates |
| medium_packet_ratio | The ratio of the count of uploaded packet sizes in the size range of 200-400 bytes and the overall total number of packets. This feature is calculated over the entire dataset collected. |
Next, we visualize the importance of each feature in the model. Our top feature is actually built on top of another feature, inter-packet delay, which measures the amount of time between the previous packet and next packet. We decided to take a rolling mean of 10 second window over inter-packet delay, which can reveal precise periodic patterns in how each provider transmits packets.
Our next two best features both look at the behavior of bytes uploaded by the client, and our intuition behind these features is that different streaming providers would require clients to upload packets of varying sizes, such as acknowledgement packets. The first of these two features is the coefficient of variation of uploaded bytes, which is the ratio of the standard deviation over the mean of our uploaded bytes. This ratio helps the model understand the variability of uploaded packets for each provider. Similarly, simply using the mean of the uploaded bytes of each 1.5 minute data chunk also proved to be a huge differentiating factor for each provider.
Surprisingly, the maximum prominence of packet download frequency did not perform as well as other features. We hypothesize that this feature was only useful when differentiating between Browsing and Streaming due to the huge difference in download volume, but as long as we’re only comparing streaming providers, their similar download volumes cannot be clarified through this feature. However, for the exception of rolling means of inter-packet delay, the rest of our features only utilize means and ratios. Even with the simplicity of these features, they are able to perform well in combination with one another and capture the essential differences in each provider.
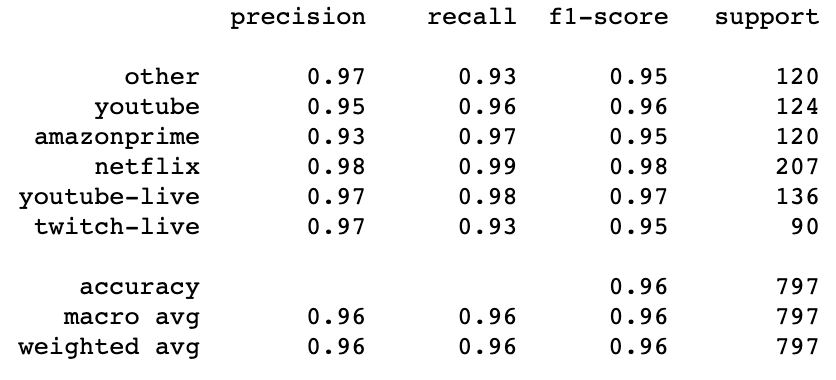
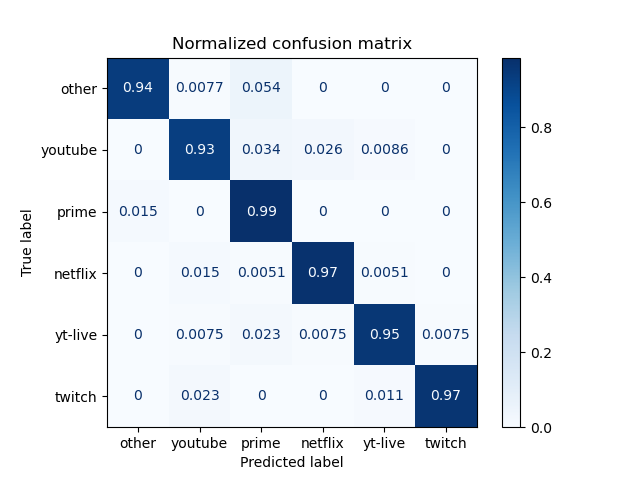
Next, we want to analyze our model’s performance on each provider class. Our model performs well on every class, with the exception of Amazon Prime, which has the lowest precision score of 0.93. In terms of our classifier, precision is more important than recall since the cost of false negatives is higher than the cost of false negatives. Therefore, even when the “Other” and Twitch categories have lower recall scores, their high precision scores make up for that loss.
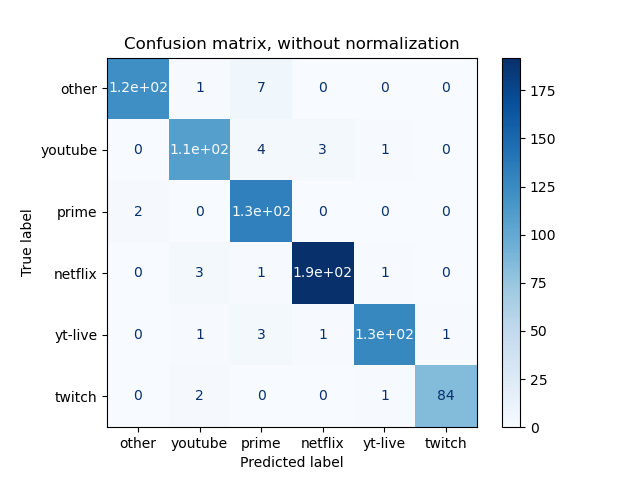
Finally, we take a look at the confusion matrices below breaking down where our model performed well and where it failed to predict accurately. We see that Youtube and Amazon Prime have the most incorrectly classified cases. One interesting observation is that Amazon Prime is most commonly incorrectly classified as the “Other” category, meaning that Prime may exhibit similar streaming patterns with one of the Other providers. On the other hand, Youtube can be misclassified as almost any of the providers. For Other, Netflix, Youtube Live, and Twitch, these categories all have an average of less than 1% of misclassified cases.
We also hypothesize that because Twitch is owned by Amazon, Twitch would exhibit similar streaming patterns as Amazon Prime. We made a similar hypothesis for Youtube vs Youtube Live. However, we see that our model performs well when differentiating between these pairs of providers.
Accomplishments, Limitations, and Future Directions
| Accomplishments | Limitations | Future Directions |
|---|---|---|
| Our model performs well on our test data | Our test data could be more robust | Create a more robust Dataset |
| Generalizable Features that could be used on new providers | Currently Can only do our 5 providers against an other category | Collect more data from different providers and integrate them into the model |


-
Currently our data only consist of 1x playback speed and was recorded in a clean setting, meaning there was no other data being sent or received, such as with messages or other browsing. We can make it more robust by adding more playback speeds and introducing noisy data into our dataset
-
Currently our model can only identify the 5 streaming providers against another class. However, we did initally begin with Netflix, Youtube, and Amazon Prime against an other class. With the addition of Twitch and Youtube Live, we believe the features are generalizable to other providers. This could be confirmed by training the model on more providers. Many more providers are entering the market such as Peacock from NBC, Paramount+, CBS All Access and many more. It will be beneficial for Viasat to understand how these many different providers send data across a VPN, and our model is an awesome tool to do that with!
Takeaways
- We were able to make a model that classified the providers with 96.5% accuracy! We were able to acheive this through selecting a good model and creating informative features that allowed for high precision in identifying the providers.
- The features we selected for our model worked well in making classification based on the various differences between different providers.
- The features are also generalizable such that the classification is not merely dependent on some features fitted exactly to the streaming providers which we have in our training data. They works well when we incorporate more providers and even live streaming providers like Youtube live and Twitch live, whose internet data patterns look very different from the providers we already included.
- We have identified the limitations of our project, which can be addressed and improved in the future by ISPs(Internet Service Providers) like Viasat to improve their services.